
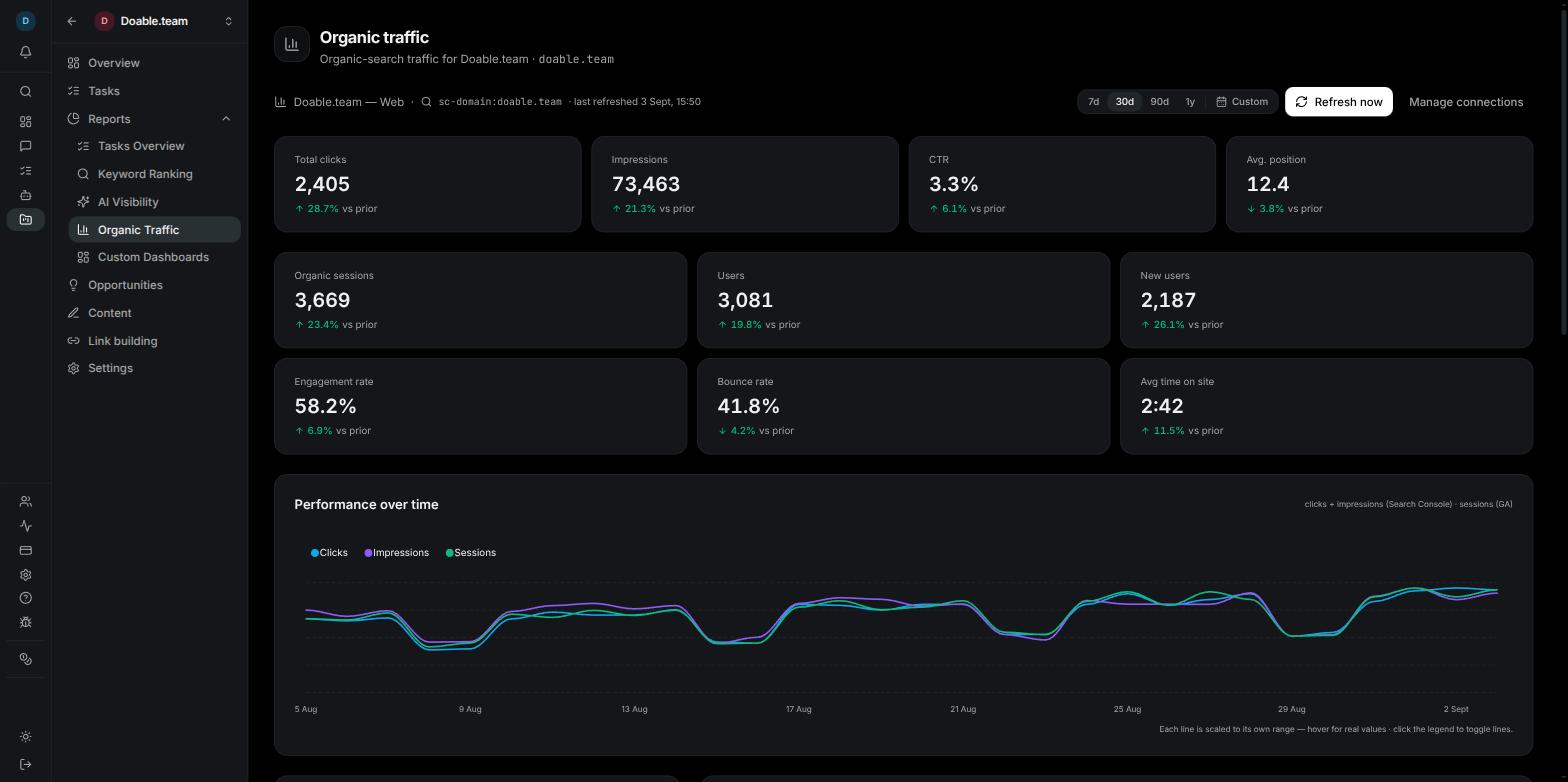
The Organic Traffic report with both Google sources connected: the Search Console and Google Analytics stat rows above the Performance over time chart.
What the report shows
From Google Search Console
Search Console describes the site as Google shows it: how often it appears, how often it gets clicked, and where it ranks.From Google Analytics (GA4)
Google Analytics describes what visitors do after they arrive. Only visits that Google Analytics attributes to the Organic Search channel are counted here; direct, referral, paid and social traffic are not shown.Performance over time
The Performance over time chart plots daily Clicks and Impressions from Search Console and Sessions from Google Analytics on one graph. Each line is scaled to its own range so the shapes are comparable even when the numbers are far apart. Hover any point for the real values, and click an entry in the legend to hide or show that line.Change against the prior period
Every stat carries a comparison with the equal-length window immediately before the one you selected, for example ▲ 12.3% vs prior. You see No prior period when there is no earlier data to compare against, and 0% vs prior when nothing moved.Connect Google Analytics and Search Console
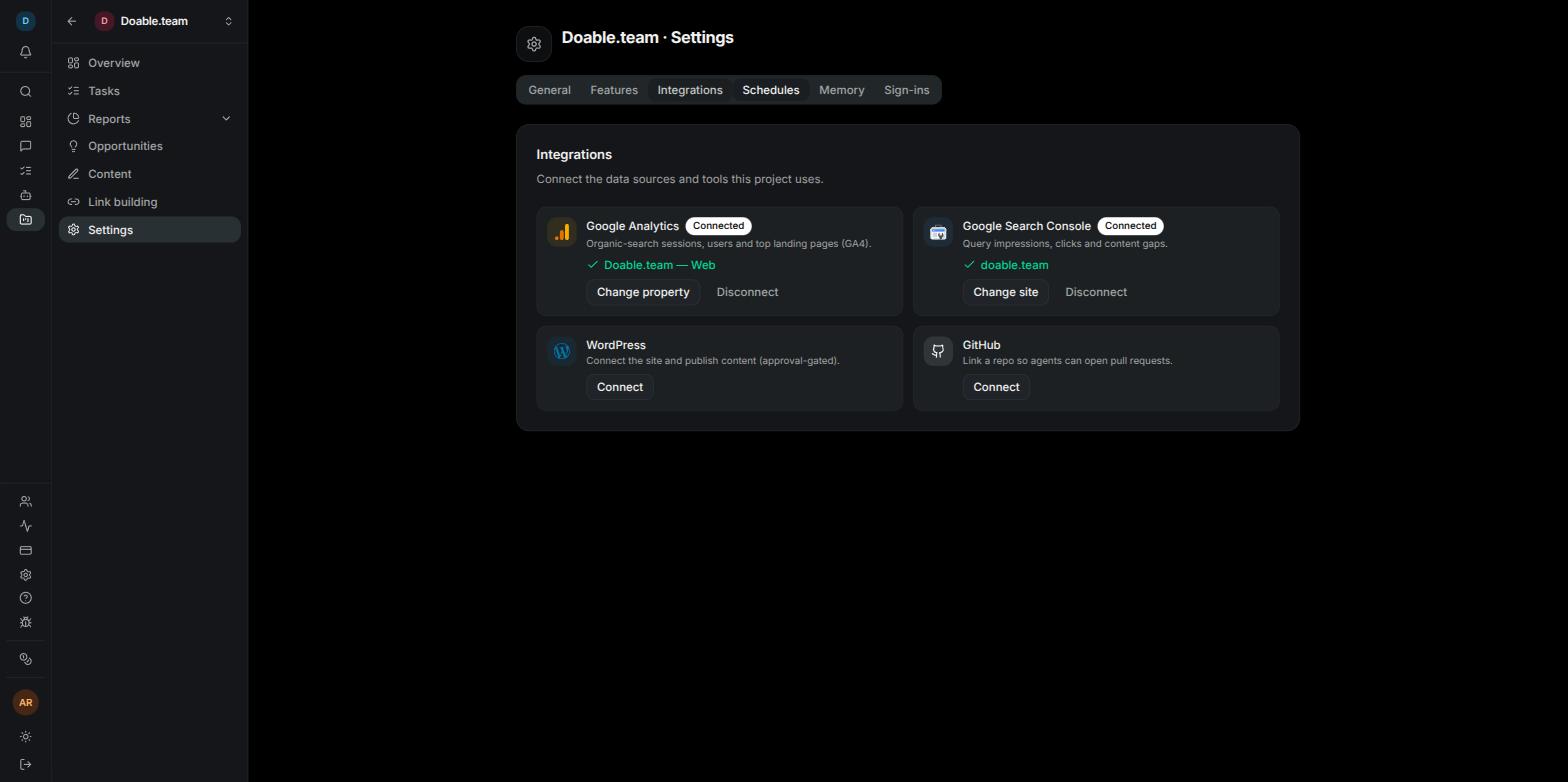
Settings → Integrations: the Google Analytics and Google Search Console tiles, each with its own status badge and Connect button.
- Google Analytics (GA4)
- Google Search Console
Open the project's Settings → Integrations
Click Connect on the Google Analytics tile
Choose the property
Open the report
Before anything is connected
With neither source connected, the report shows a setup card titled Connect Google Analytics or Search Console. It explains that Search Console brings clicks, impressions, queries and pages, while GA4 brings sessions, users and engagement, and that either one is enough to start. A checklist shows Google Analytics (GA4 property) and Google Search Console (site), with a green tick against whichever is already done. Click Connect in Settings → Integrations to go there.When only one source is connected
The page renders as soon as one source is connected. The half that belongs to the other source appears as a blurred placeholder with a lock and a button: Connect Google Analytics when only Search Console is connected, or Connect Search Console when only Google Analytics is. A locked block never shows invented numbers. For example, with Search Console alone you get the full stat row, the queries, pages, devices and countries, while the sessions, users and engagement row stays locked until a GA4 property is chosen.Keep the data fresh
Automatic refresh
For the preset windows (7d, 30d, 90d, 1y) the report is served from a stored copy that Visibility refreshes on the project’s schedule. New projects refresh traffic twice a day: the Organic Traffic card under Settings → Schedules reads Daily at 00:00, 12:00 UTC. Click Edit on that card to change the frequency, or Run now to refresh immediately. The card lists GA property connected as its requirement, so it becomes Active once a GA4 property is chosen. Refreshing traffic does not spend Credits.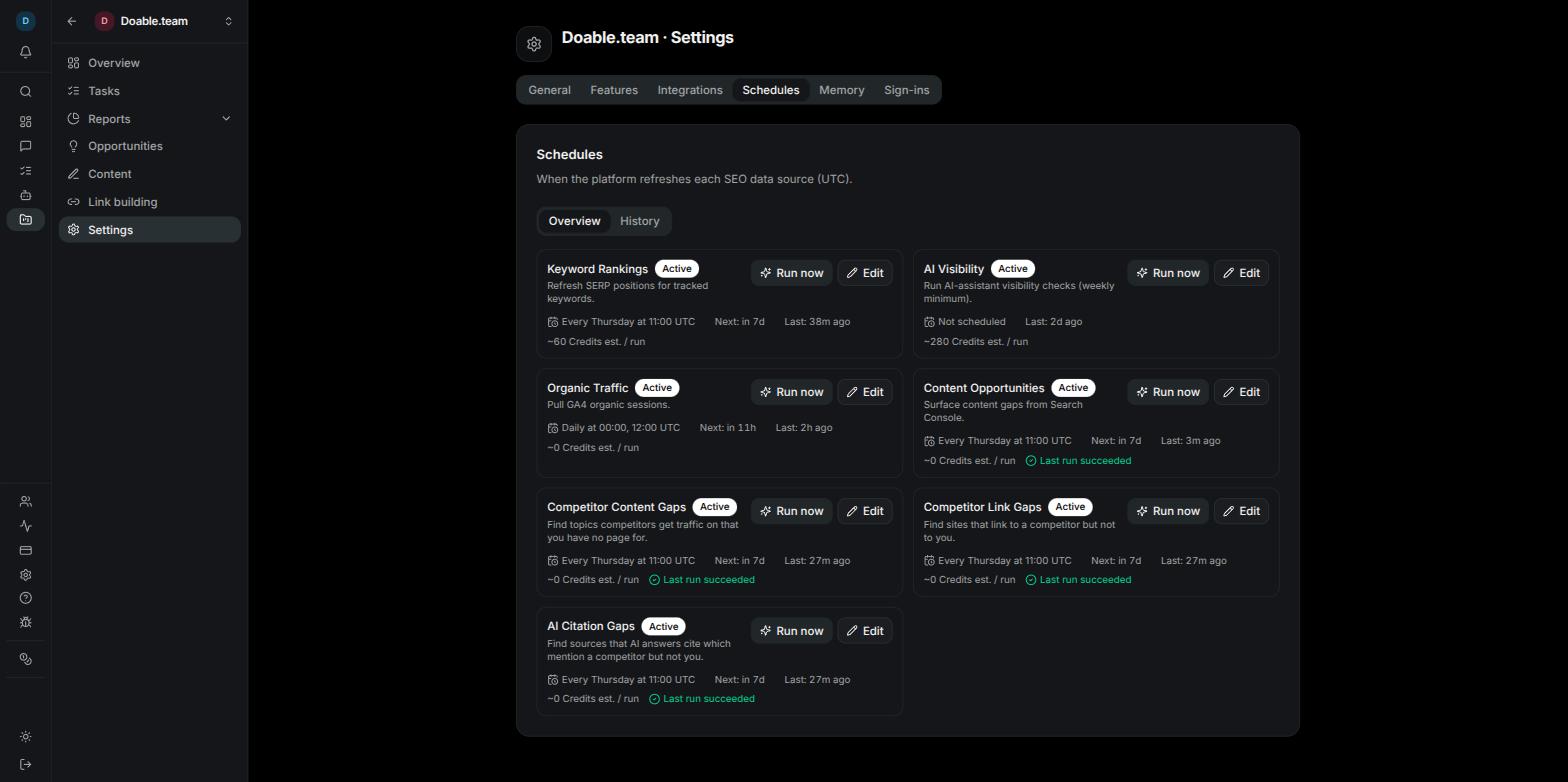
Settings → Schedules: the Organic Traffic card with its schedule, next and last run, and the Run now and Edit buttons.
Refresh now
Open the report
Click Refresh now
Check the status line
What the status line means
The status line above the stats names the GA4 property, the Search Console site and how fresh the numbers are.Search Console runs about two days behind
Google finalises Search Console data roughly two days after the fact, so every Search Console window, preset or custom, ends two days ago. Google Analytics figures do not have this delay, which is why the Sessions line on the Performance over time chart runs two days further than the Clicks and Impressions lines. This is normal, not a missing refresh.Choose a date range
Pick a preset or Custom
For Custom, set the start and end
Read the result
Manage connections
Click Manage connections in the report header to jump to the project’s Settings → Integrations tab, where both Google tiles live.Change the property or site
Use Change property on the Google Analytics tile or Change site on the Search Console tile to open the same picker you used when connecting. Only the teammate whose Google account made the connection can change the selection, because Google only lists what that account can see. For everyone else the button is disabled with a message naming who can set it and suggesting you Disconnect and reconnect with your own Google account to manage it yourself.Reconnect
A red Reconnect badge on a tile means data has stopped flowing. The tile explains why in plain words, for example that read access was never granted, that the connected Google account no longer has access to the site, or Disconnected automatically — Google Analytics data has stopped updating. after repeated errors from Google. Click Reconnect and approve on Google’s screen. When Visibility switches a connection off automatically, the people who can fix it also receive an Inbox notification.Disconnect
Disconnect removes the connection and the tile returns to Connect; a toast confirms Google Analytics disconnected or Search Console disconnected. Anyone with Manage integrations can do this.Fix “connected to different websites”
When both sources are connected but point at different websites, the report is replaced by a red alert, Analytics and Search Console are connected to different websites, so numbers from two sites are never mixed.Read the alert
Click Fix in Settings → Integrations
Refresh
Troubleshooting
I cancelled on Google's screen
I cancelled on Google's screen
I declined the permission Google asked for
I declined the permission Google asked for
The picker is empty
The picker is empty
The report says the snapshot predates my data
The report says the snapshot predates my data
Where else traffic appears
- Project Overview: the Organic traffic section summarises the stat strip, Performance over time, Top queries, Top pages and Devices, plus a Google Analytics-only Top landing pages list with sessions and bounce rate. Its Traffic report button opens this page.
- Projects list: each project card shows sessions and clicks, or — when the source is not connected.
- Custom Dashboards: the Organic Traffic widget group offers Traffic KPIs and Traffic trend. Traffic widgets on a shared link use the Google connection of the person who created the dashboard. See Dashboards.
- Opportunities: the connected Search Console site also powers the content gap findings. See Opportunities.