> ## Documentation Index
> Fetch the complete documentation index at: https://docs.visibility.so/llms.txt
> Use this file to discover all available pages before exploring further.
# Organic traffic
> Read what Google search sends to a project using Google Search Console and Google Analytics data, connect either or both, and keep the report fresh.
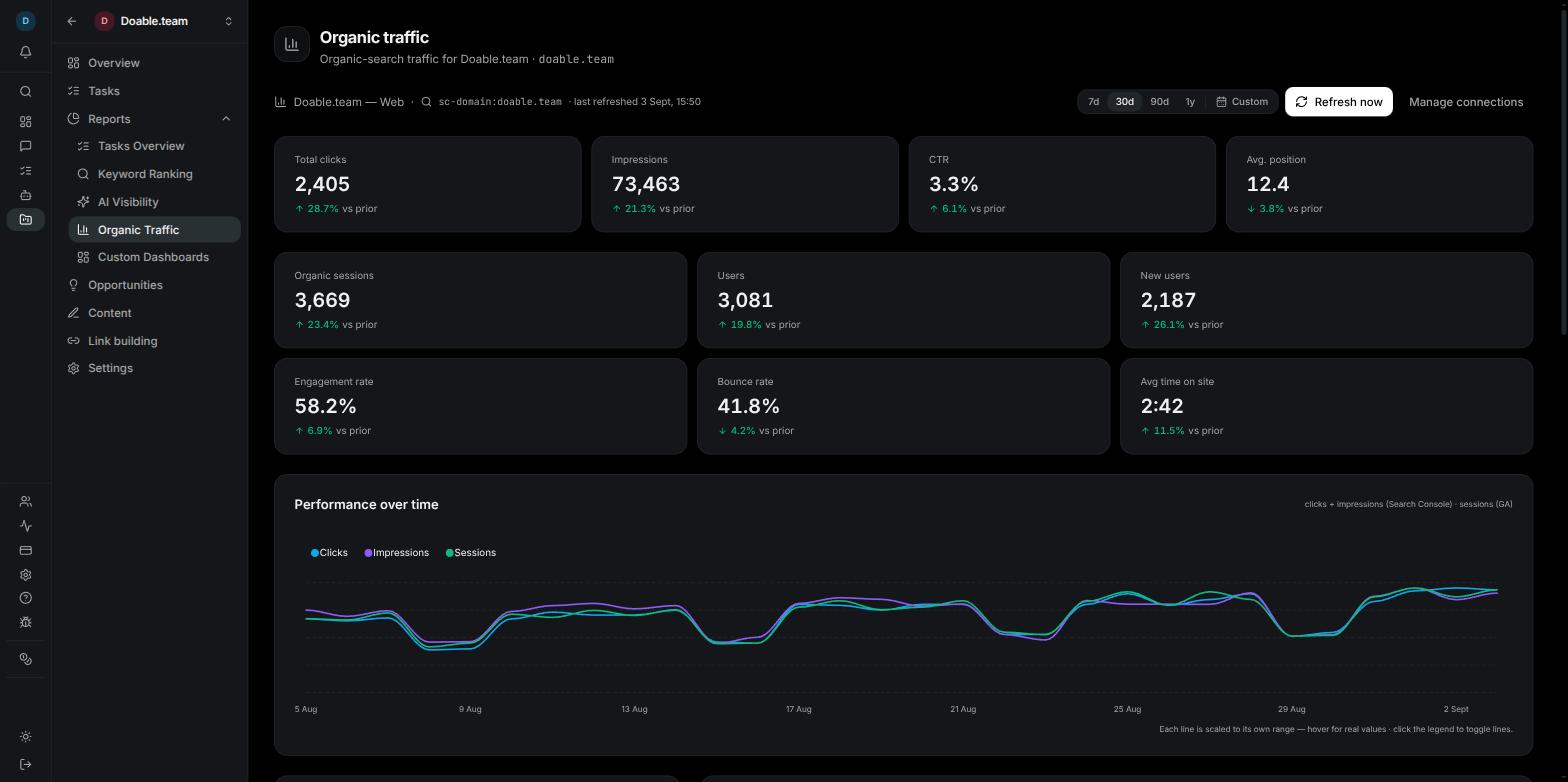
The **Organic Traffic** report shows what Google search is sending to a project's website and what visitors do once they land. It draws on two Google sources: **Google Search Console** for how the site appears in search results, and **Google Analytics (GA4)** for what happens after the click. Either source alone fills its own half of the page; connect both and they chart side by side.
Open it from the project sidebar under **Reports** → **Organic Traffic**, or press Ctrl/Cmd+K and choose **Project · Organic Traffic**.
 ## What the report shows
### From Google Search Console
Search Console describes the site as Google shows it: how often it appears, how often it gets clicked, and where it ranks.
| Block | What it tells you |
| ----------------- | ------------------------------------------------------------------------------------------------------------------------------ |
| **Total clicks** | Visits that started from a Google result for this site in the selected window. |
| **Impressions** | How many times the site appeared in Google results. |
| **CTR** | Click-through rate: clicks divided by impressions. |
| **Avg. position** | The site's average ranking across the queries it appeared for. Lower is better. |
| **Top queries** | The ten searches that sent the most traffic, with clicks, impressions, CTR and position for each. |
| **Top pages** | The ten pages that received the most search traffic, with the same four columns. |
| **Devices** | Share bars showing how clicks split across device types. |
| **Countries** | A world map of where clicks come from. Hover a country for its clicks and impressions; the top five are listed beside the map. |
### From Google Analytics (GA4)
Google Analytics describes what visitors do after they arrive. Only visits that Google Analytics attributes to the **Organic Search** channel are counted here; direct, referral, paid and social traffic are not shown.
| Block | What it tells you |
| -------------------- | --------------------------------------------------------- |
| **Organic sessions** | Visits that came from organic search. |
| **Users** | The number of distinct people behind those sessions. |
| **New users** | Visitors seeing the site for the first time. |
| **Engagement rate** | The share of sessions Google Analytics counts as engaged. |
| **Bounce rate** | The share of sessions that were not engaged. |
| **Avg time on site** | Average session duration. |
The Organic Traffic page shows Search Console's **Top pages**. Google Analytics landing pages (sessions and bounce rate, top five) appear only in the project Overview's **Organic traffic** section.
### Performance over time
The **Performance over time** chart plots daily **Clicks** and **Impressions** from Search Console and **Sessions** from Google Analytics on one graph. Each line is scaled to its own range so the shapes are comparable even when the numbers are far apart. Hover any point for the real values, and click an entry in the legend to hide or show that line.
### Change against the prior period
Every stat carries a comparison with the equal-length window immediately before the one you selected, for example **▲ 12.3% vs prior**. You see **No prior period** when there is no earlier data to compare against, and **0% vs prior** when nothing moved.
## Connect Google Analytics and Search Console
Google Analytics and Google Search Console are connected separately. The project's **Settings** → **Integrations** tab has one tile for each, with its own **Connect** button and its own Google consent screen asking for a single read-only permission. You can connect either one without the other.
Connecting, choosing a property or site, and disconnecting need the **Manage integrations** permission, which the **Admin** and **Manager** roles have by default. Any member of the Company can view the report and refresh it. See [Team management](/team-management) for permissions.
## What the report shows
### From Google Search Console
Search Console describes the site as Google shows it: how often it appears, how often it gets clicked, and where it ranks.
| Block | What it tells you |
| ----------------- | ------------------------------------------------------------------------------------------------------------------------------ |
| **Total clicks** | Visits that started from a Google result for this site in the selected window. |
| **Impressions** | How many times the site appeared in Google results. |
| **CTR** | Click-through rate: clicks divided by impressions. |
| **Avg. position** | The site's average ranking across the queries it appeared for. Lower is better. |
| **Top queries** | The ten searches that sent the most traffic, with clicks, impressions, CTR and position for each. |
| **Top pages** | The ten pages that received the most search traffic, with the same four columns. |
| **Devices** | Share bars showing how clicks split across device types. |
| **Countries** | A world map of where clicks come from. Hover a country for its clicks and impressions; the top five are listed beside the map. |
### From Google Analytics (GA4)
Google Analytics describes what visitors do after they arrive. Only visits that Google Analytics attributes to the **Organic Search** channel are counted here; direct, referral, paid and social traffic are not shown.
| Block | What it tells you |
| -------------------- | --------------------------------------------------------- |
| **Organic sessions** | Visits that came from organic search. |
| **Users** | The number of distinct people behind those sessions. |
| **New users** | Visitors seeing the site for the first time. |
| **Engagement rate** | The share of sessions Google Analytics counts as engaged. |
| **Bounce rate** | The share of sessions that were not engaged. |
| **Avg time on site** | Average session duration. |
The Organic Traffic page shows Search Console's **Top pages**. Google Analytics landing pages (sessions and bounce rate, top five) appear only in the project Overview's **Organic traffic** section.
### Performance over time
The **Performance over time** chart plots daily **Clicks** and **Impressions** from Search Console and **Sessions** from Google Analytics on one graph. Each line is scaled to its own range so the shapes are comparable even when the numbers are far apart. Hover any point for the real values, and click an entry in the legend to hide or show that line.
### Change against the prior period
Every stat carries a comparison with the equal-length window immediately before the one you selected, for example **▲ 12.3% vs prior**. You see **No prior period** when there is no earlier data to compare against, and **0% vs prior** when nothing moved.
## Connect Google Analytics and Search Console
Google Analytics and Google Search Console are connected separately. The project's **Settings** → **Integrations** tab has one tile for each, with its own **Connect** button and its own Google consent screen asking for a single read-only permission. You can connect either one without the other.
Connecting, choosing a property or site, and disconnecting need the **Manage integrations** permission, which the **Admin** and **Manager** roles have by default. Any member of the Company can view the report and refresh it. See [Team management](/team-management) for permissions.
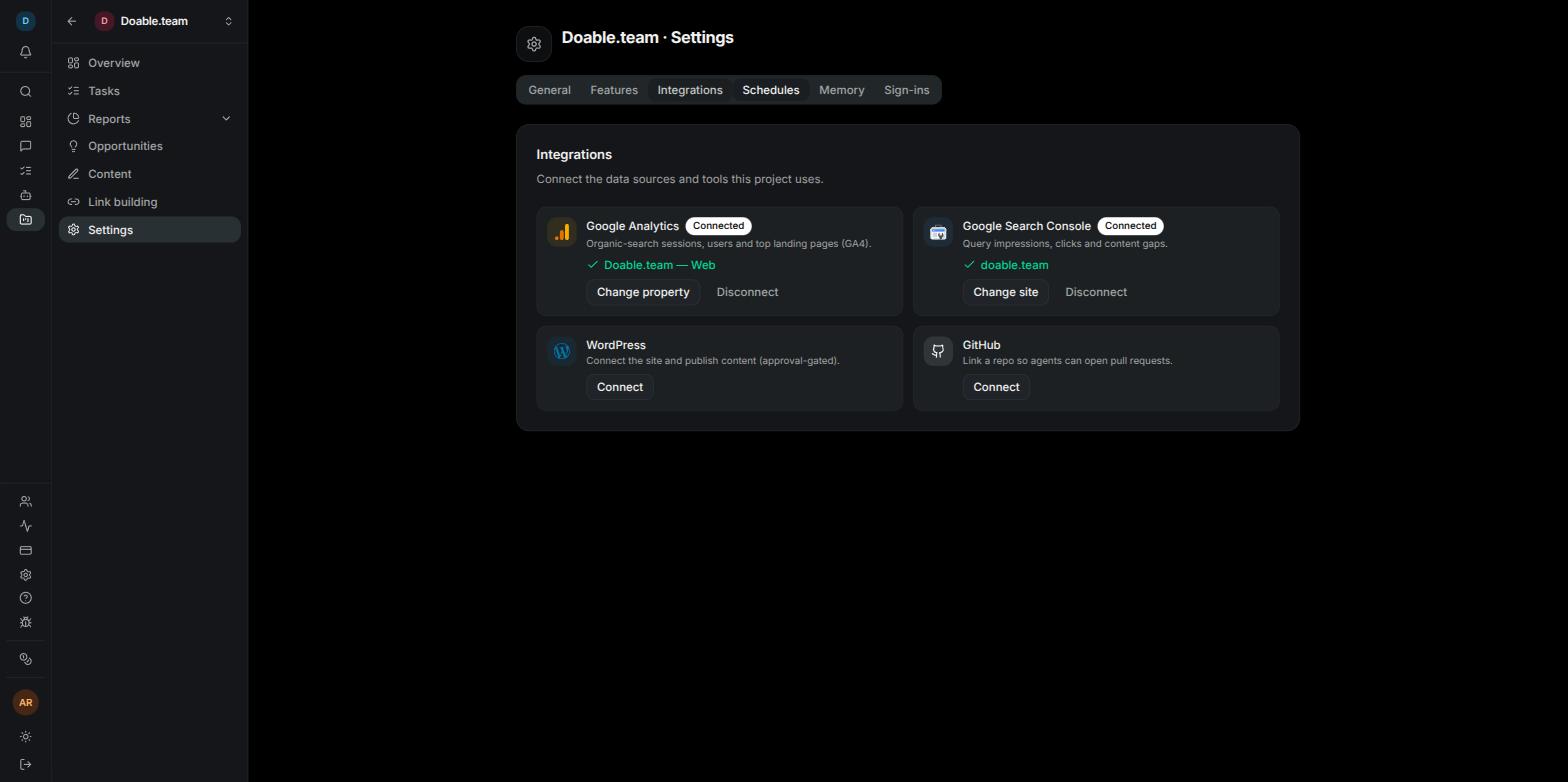 Open the project from the sidebar, click **Settings**, then the **Integrations** tab.
You are sent to Google. Sign in with the account that can see the property and click **Allow**. Visibility asks for one read-only Analytics permission.
Back on the Integrations tab, the toast reads **Google Analytics connected** and the tile badge says **Choose property**. Click it. In **Choose a GA4 property**, properties are grouped by Analytics account with their numeric IDs. Click the one for this project's website; the toast confirms **Property selected**.
The tile now reads **Connected** with the property name. Go to **Reports** → **Organic Traffic**: the Google Analytics blocks fill on first load or after you click **Refresh now**.
Open the project from the sidebar, click **Settings**, then the **Integrations** tab.
Sign in to Google and click **Allow**. Visibility asks for one read-only Search Console permission.
The toast reads **Search Console connected** and the badge says **Choose site**. Click it. In **Choose a Search Console site**, pick the verified site for this project. Domain properties appear as `sc-domain:example.com`, and each row shows your permission level. The toast confirms **Site selected**.
Go to **Reports** → **Organic Traffic**: clicks, impressions, queries, pages, devices and countries fill in.
The setup bar on the project Overview lists **Connect Search Console** and **Connect Google Analytics** until both are done. Each row links straight to the Integrations tab. See [Projects](/projects).
Only verified sites appear in the Search Console picker. If the Google account has none, the picker says **No verified sites on this Google account.** Likewise, an account with no GA4 properties shows **No GA4 properties on this Google account.** Sign in with a different Google account, or ask the site owner to grant you access in Google first.
### Before anything is connected
With neither source connected, the report shows a setup card titled **Connect Google Analytics or Search Console**. It explains that Search Console brings clicks, impressions, queries and pages, while GA4 brings sessions, users and engagement, and that either one is enough to start. A checklist shows **Google Analytics (GA4 property)** and **Google Search Console (site)**, with a green tick against whichever is already done. Click **Connect in Settings → Integrations** to go there.
### When only one source is connected
The page renders as soon as one source is connected. The half that belongs to the other source appears as a blurred placeholder with a lock and a button: **Connect Google Analytics** when only Search Console is connected, or **Connect Search Console** when only Google Analytics is. A locked block never shows invented numbers. For example, with Search Console alone you get the full stat row, the queries, pages, devices and countries, while the sessions, users and engagement row stays locked until a GA4 property is chosen.
## Keep the data fresh
### Automatic refresh
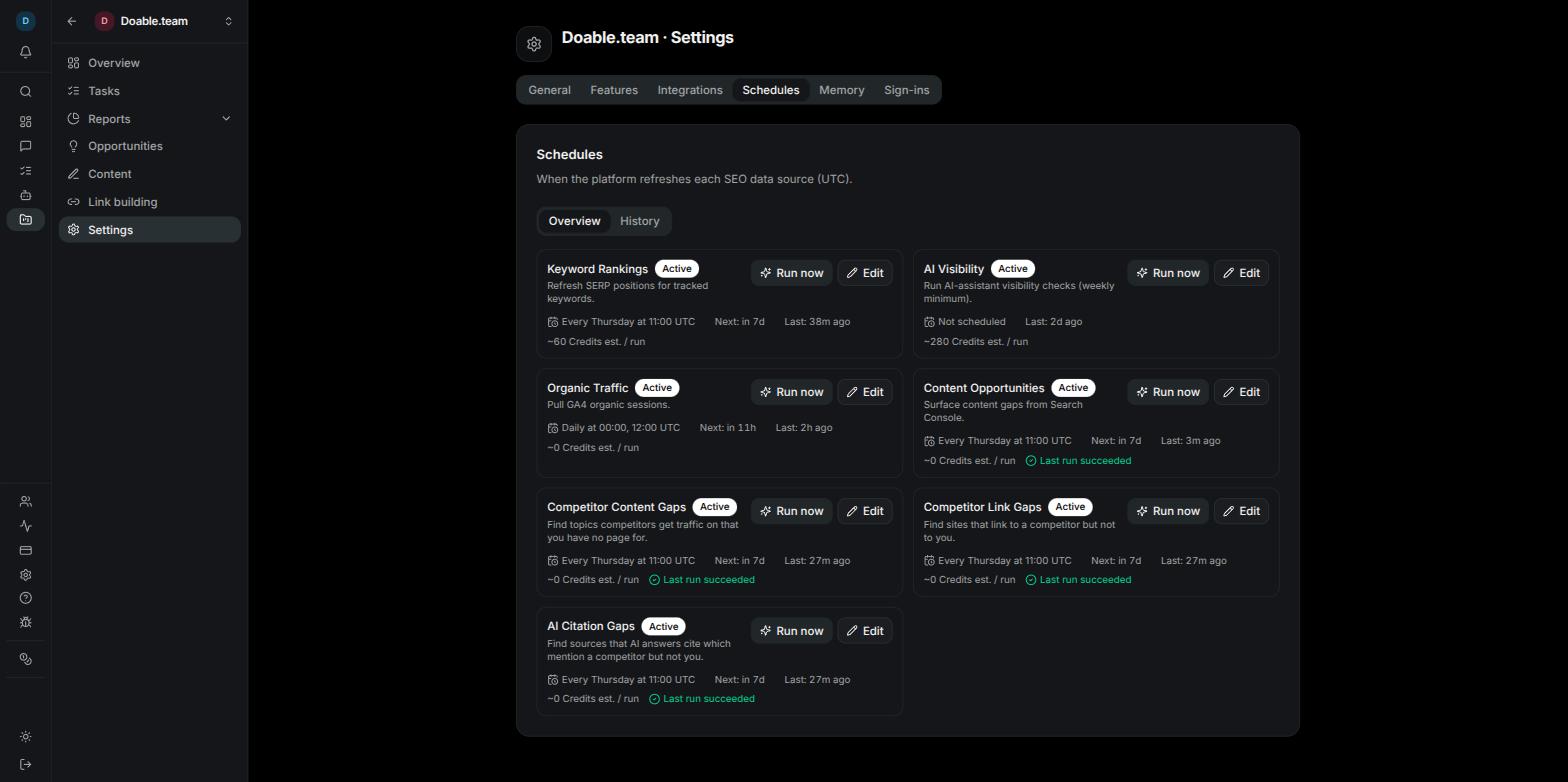
For the preset windows (7d, 30d, 90d, 1y) the report is served from a stored copy that Visibility refreshes on the project's schedule. New projects refresh traffic twice a day: the **Organic Traffic** card under **Settings** → **Schedules** reads **Daily at 00:00, 12:00 UTC**. Click **Edit** on that card to change the frequency, or **Run now** to refresh immediately. The card lists **GA property connected** as its requirement, so it becomes **Active** once a GA4 property is chosen. Refreshing traffic does not spend Credits.
Open the project from the sidebar, click **Settings**, then the **Integrations** tab.
You are sent to Google. Sign in with the account that can see the property and click **Allow**. Visibility asks for one read-only Analytics permission.
Back on the Integrations tab, the toast reads **Google Analytics connected** and the tile badge says **Choose property**. Click it. In **Choose a GA4 property**, properties are grouped by Analytics account with their numeric IDs. Click the one for this project's website; the toast confirms **Property selected**.
The tile now reads **Connected** with the property name. Go to **Reports** → **Organic Traffic**: the Google Analytics blocks fill on first load or after you click **Refresh now**.
Open the project from the sidebar, click **Settings**, then the **Integrations** tab.
Sign in to Google and click **Allow**. Visibility asks for one read-only Search Console permission.
The toast reads **Search Console connected** and the badge says **Choose site**. Click it. In **Choose a Search Console site**, pick the verified site for this project. Domain properties appear as `sc-domain:example.com`, and each row shows your permission level. The toast confirms **Site selected**.
Go to **Reports** → **Organic Traffic**: clicks, impressions, queries, pages, devices and countries fill in.
The setup bar on the project Overview lists **Connect Search Console** and **Connect Google Analytics** until both are done. Each row links straight to the Integrations tab. See [Projects](/projects).
Only verified sites appear in the Search Console picker. If the Google account has none, the picker says **No verified sites on this Google account.** Likewise, an account with no GA4 properties shows **No GA4 properties on this Google account.** Sign in with a different Google account, or ask the site owner to grant you access in Google first.
### Before anything is connected
With neither source connected, the report shows a setup card titled **Connect Google Analytics or Search Console**. It explains that Search Console brings clicks, impressions, queries and pages, while GA4 brings sessions, users and engagement, and that either one is enough to start. A checklist shows **Google Analytics (GA4 property)** and **Google Search Console (site)**, with a green tick against whichever is already done. Click **Connect in Settings → Integrations** to go there.
### When only one source is connected
The page renders as soon as one source is connected. The half that belongs to the other source appears as a blurred placeholder with a lock and a button: **Connect Google Analytics** when only Search Console is connected, or **Connect Search Console** when only Google Analytics is. A locked block never shows invented numbers. For example, with Search Console alone you get the full stat row, the queries, pages, devices and countries, while the sessions, users and engagement row stays locked until a GA4 property is chosen.
## Keep the data fresh
### Automatic refresh
For the preset windows (7d, 30d, 90d, 1y) the report is served from a stored copy that Visibility refreshes on the project's schedule. New projects refresh traffic twice a day: the **Organic Traffic** card under **Settings** → **Schedules** reads **Daily at 00:00, 12:00 UTC**. Click **Edit** on that card to change the frequency, or **Run now** to refresh immediately. The card lists **GA property connected** as its requirement, so it becomes **Active** once a GA4 property is chosen. Refreshing traffic does not spend Credits.
 ### Refresh now
Go to the project's **Reports** → **Organic Traffic** with a preset window selected.
The button reads **Refreshing…** while Visibility pulls the latest figures from Google.
A toast confirms **Organic traffic refreshed** and the status line updates to **last refreshed** with the new date and time.
**Refresh now** is hidden while a custom date range is selected, because custom ranges are always fetched live.
### What the status line means
The status line above the stats names the GA4 property, the Search Console site and how fresh the numbers are.
| You see | It means |
| ---------------------------------------------------------------------------------------------------------- | ------------------------------------------------------------------------------------------------------------------------------------------------------ |
| **last refreshed** with a date and time | You are looking at the stored copy from that moment. Click **Refresh now** for newer data. |
| **live from Google** | The numbers were fetched from Google just now. You see this for a custom date range, and for a preset window whose stored copy is more than a day old. |
| **Connected — click Refresh to pull your latest organic traffic.** | A source is connected but nothing has been fetched yet. Click **Refresh now**. |
| **This snapshot predates the Search Console data — hit Refresh now…** (or the Google Analytics equivalent) | You connected that source after the last refresh. Click **Refresh now** to include it. |
### Search Console runs about two days behind
Google finalises Search Console data roughly two days after the fact, so every Search Console window, preset or custom, ends two days ago. Google Analytics figures do not have this delay, which is why the **Sessions** line on the **Performance over time** chart runs two days further than the **Clicks** and **Impressions** lines. This is normal, not a missing refresh.
## Choose a date range
Use the control at the top right: **7d**, **30d**, **90d**, **1y** or **Custom**. The default is 30 days.
A two-month calendar opens with the prompt **Pick a start and end date (up to 365 days)**. Choose both dates and click **Apply**.
The stats, chart and breakdowns all follow the new window. A custom range is fetched live from Google, so the status line reads **live from Google** and **Refresh now** disappears.
The selected window is kept in the page URL. Reloading keeps it, sharing the link shows a teammate the same view, and moving to [Keyword rankings](/keyword-rankings) or another report page carries the same window with you.
## Manage connections
Click **Manage connections** in the report header to jump to the project's **Settings** → **Integrations** tab, where both Google tiles live.
### Change the property or site
Use **Change property** on the Google Analytics tile or **Change site** on the Search Console tile to open the same picker you used when connecting. Only the teammate whose Google account made the connection can change the selection, because Google only lists what that account can see. For everyone else the button is disabled with a message naming who can set it and suggesting you **Disconnect** and reconnect with your own Google account to manage it yourself.
### Reconnect
A red **Reconnect** badge on a tile means data has stopped flowing. The tile explains why in plain words, for example that read access was never granted, that the connected Google account no longer has access to the site, or **Disconnected automatically — Google Analytics data has stopped updating.** after repeated errors from Google. Click **Reconnect** and approve on Google's screen. When Visibility switches a connection off automatically, the people who can fix it also receive an [Inbox](/inbox-and-approvals) notification.
### Disconnect
**Disconnect** removes the connection and the tile returns to **Connect**; a toast confirms **Google Analytics disconnected** or **Search Console disconnected**. Anyone with **Manage integrations** can do this.
Disconnecting removes your Google connection for that product across the whole Company, not just this project. Other projects that relied on it fall back to a teammate's connection if one exists; otherwise they lose that source until someone reconnects.
### Fix "connected to different websites"
When both sources are connected but point at different websites, the report is replaced by a red alert, **Analytics and Search Console are connected to different websites**, so numbers from two sites are never mixed.
It names the website Google Analytics reports on and the site Search Console is set to.
Use **Change property** or **Change site** so both point at the same website.
Return to **Organic Traffic** and click **Refresh now**.
### Troubleshooting
You see **Google Analytics not connected — You cancelled on Google's screen, so nothing was connected.** (or the Search Console equivalent). Click **Connect** again and complete the Google flow.
The message reads **You didn't grant read access. Try again and approve the permission Google asks for.** Visibility does not save a half-working connection; click **Connect** again and choose **Allow**.
**No GA4 properties on this Google account.** or **No verified sites on this Google account.** means the Google account you signed in with has no access. Ask the site owner to add you in Google Analytics or Search Console, or reconnect with an account that already has access.
You connected a source after the last automatic refresh. Click **Refresh now** and the new source's blocks fill in.
Only the teammate who connected that Google account can change the selection. Either ask them, or **Disconnect** and reconnect with your own account.
## Where else traffic appears
* **Project Overview**: the **Organic traffic** section summarises the stat strip, **Performance over time**, **Top queries**, **Top pages** and **Devices**, plus a Google Analytics-only **Top landing pages** list with sessions and bounce rate. Its **Traffic report** button opens this page.
* **Projects list**: each project card shows sessions and clicks, or **—** when the source is not connected.
* **Custom Dashboards**: the **Organic Traffic** widget group offers **Traffic KPIs** and **Traffic trend**. Traffic widgets on a shared link use the Google connection of the person who created the dashboard. See [Dashboards](/dashboards).
* **Opportunities**: the connected Search Console site also powers the content gap findings. See [Opportunities](/opportunities).
To remove the page from a project, an admin can switch **Organic traffic** off under the project's **Settings** → **Features** → **Pages**. Nothing is deleted; switch it back on at any time.
## Related pages
Every connection a project or Company can make, including WordPress and your own data providers.
Where the project's tracked keywords sit in Google, per country and device.
Project setup, the Overview, Features and Schedules.
Build client-facing dashboards from traffic and ranking widgets.
### Refresh now
Go to the project's **Reports** → **Organic Traffic** with a preset window selected.
The button reads **Refreshing…** while Visibility pulls the latest figures from Google.
A toast confirms **Organic traffic refreshed** and the status line updates to **last refreshed** with the new date and time.
**Refresh now** is hidden while a custom date range is selected, because custom ranges are always fetched live.
### What the status line means
The status line above the stats names the GA4 property, the Search Console site and how fresh the numbers are.
| You see | It means |
| ---------------------------------------------------------------------------------------------------------- | ------------------------------------------------------------------------------------------------------------------------------------------------------ |
| **last refreshed** with a date and time | You are looking at the stored copy from that moment. Click **Refresh now** for newer data. |
| **live from Google** | The numbers were fetched from Google just now. You see this for a custom date range, and for a preset window whose stored copy is more than a day old. |
| **Connected — click Refresh to pull your latest organic traffic.** | A source is connected but nothing has been fetched yet. Click **Refresh now**. |
| **This snapshot predates the Search Console data — hit Refresh now…** (or the Google Analytics equivalent) | You connected that source after the last refresh. Click **Refresh now** to include it. |
### Search Console runs about two days behind
Google finalises Search Console data roughly two days after the fact, so every Search Console window, preset or custom, ends two days ago. Google Analytics figures do not have this delay, which is why the **Sessions** line on the **Performance over time** chart runs two days further than the **Clicks** and **Impressions** lines. This is normal, not a missing refresh.
## Choose a date range
Use the control at the top right: **7d**, **30d**, **90d**, **1y** or **Custom**. The default is 30 days.
A two-month calendar opens with the prompt **Pick a start and end date (up to 365 days)**. Choose both dates and click **Apply**.
The stats, chart and breakdowns all follow the new window. A custom range is fetched live from Google, so the status line reads **live from Google** and **Refresh now** disappears.
The selected window is kept in the page URL. Reloading keeps it, sharing the link shows a teammate the same view, and moving to [Keyword rankings](/keyword-rankings) or another report page carries the same window with you.
## Manage connections
Click **Manage connections** in the report header to jump to the project's **Settings** → **Integrations** tab, where both Google tiles live.
### Change the property or site
Use **Change property** on the Google Analytics tile or **Change site** on the Search Console tile to open the same picker you used when connecting. Only the teammate whose Google account made the connection can change the selection, because Google only lists what that account can see. For everyone else the button is disabled with a message naming who can set it and suggesting you **Disconnect** and reconnect with your own Google account to manage it yourself.
### Reconnect
A red **Reconnect** badge on a tile means data has stopped flowing. The tile explains why in plain words, for example that read access was never granted, that the connected Google account no longer has access to the site, or **Disconnected automatically — Google Analytics data has stopped updating.** after repeated errors from Google. Click **Reconnect** and approve on Google's screen. When Visibility switches a connection off automatically, the people who can fix it also receive an [Inbox](/inbox-and-approvals) notification.
### Disconnect
**Disconnect** removes the connection and the tile returns to **Connect**; a toast confirms **Google Analytics disconnected** or **Search Console disconnected**. Anyone with **Manage integrations** can do this.
Disconnecting removes your Google connection for that product across the whole Company, not just this project. Other projects that relied on it fall back to a teammate's connection if one exists; otherwise they lose that source until someone reconnects.
### Fix "connected to different websites"
When both sources are connected but point at different websites, the report is replaced by a red alert, **Analytics and Search Console are connected to different websites**, so numbers from two sites are never mixed.
It names the website Google Analytics reports on and the site Search Console is set to.
Use **Change property** or **Change site** so both point at the same website.
Return to **Organic Traffic** and click **Refresh now**.
### Troubleshooting
You see **Google Analytics not connected — You cancelled on Google's screen, so nothing was connected.** (or the Search Console equivalent). Click **Connect** again and complete the Google flow.
The message reads **You didn't grant read access. Try again and approve the permission Google asks for.** Visibility does not save a half-working connection; click **Connect** again and choose **Allow**.
**No GA4 properties on this Google account.** or **No verified sites on this Google account.** means the Google account you signed in with has no access. Ask the site owner to add you in Google Analytics or Search Console, or reconnect with an account that already has access.
You connected a source after the last automatic refresh. Click **Refresh now** and the new source's blocks fill in.
Only the teammate who connected that Google account can change the selection. Either ask them, or **Disconnect** and reconnect with your own account.
## Where else traffic appears
* **Project Overview**: the **Organic traffic** section summarises the stat strip, **Performance over time**, **Top queries**, **Top pages** and **Devices**, plus a Google Analytics-only **Top landing pages** list with sessions and bounce rate. Its **Traffic report** button opens this page.
* **Projects list**: each project card shows sessions and clicks, or **—** when the source is not connected.
* **Custom Dashboards**: the **Organic Traffic** widget group offers **Traffic KPIs** and **Traffic trend**. Traffic widgets on a shared link use the Google connection of the person who created the dashboard. See [Dashboards](/dashboards).
* **Opportunities**: the connected Search Console site also powers the content gap findings. See [Opportunities](/opportunities).
To remove the page from a project, an admin can switch **Organic traffic** off under the project's **Settings** → **Features** → **Pages**. Nothing is deleted; switch it back on at any time.
## Related pages
Every connection a project or Company can make, including WordPress and your own data providers.
Where the project's tracked keywords sit in Google, per country and device.
Project setup, the Overview, Features and Schedules.
Build client-facing dashboards from traffic and ranking widgets.